
How much can I spend?
v3.5.2
• Unlocked
| Updated On | |
|---|---|
| Google Play ID | com.tradingview.tradingviewapp |
| Category | Finance |
| Version | 1.20.86.0.1002565 |
| Size | 108 MB |
| MOD Feature | Not available |
| Requires | Android 11 |
| Price | |
| Free | |
| Content Rating | |
| Everyone | |
| Internet Required | |
| Required | |

TradingView is a powerful market analysis app designed for anyone interested in stocks, cryptocurrencies, forex, and other financial instruments. By combining live market data, customizable charts, technical indicators, and an active investor community, it makes financial research more accessible from mobile devices. Whether you are learning about market movements or managing a diversified investment portfolio, this app provides practical tools to follow price changes and explore trading opportunities.
Keeping up with financial markets requires access to reliable information and convenient analytical tools. TradingView brings these resources together in one interface, helping users monitor different asset classes without switching between multiple platforms.
TradingView is more than a simple stock price tracker. It provides an extensive collection of market information, interactive charts, and analytical resources for both beginners and experienced traders. Users can follow stocks, futures, forex pairs, popular indices, bonds, ETFs, commodities, and cryptocurrencies.
The platform also supports different approaches to market research, allowing individuals to examine price movements, compare assets, and develop their own trading strategies. Its visual interface makes complex financial information easier to understand, while customizable tools provide additional flexibility for more advanced analysis.
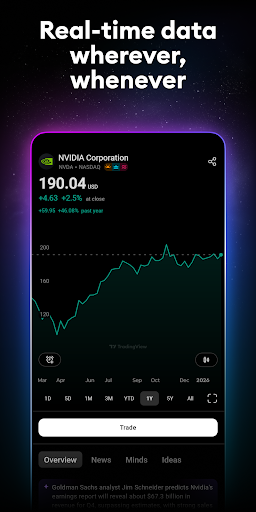
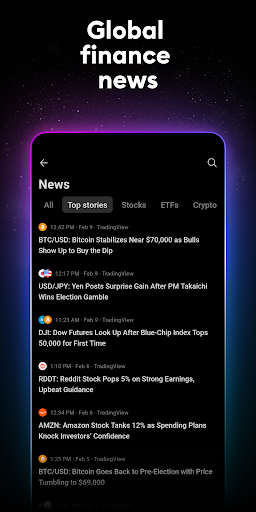
Timely information is essential when monitoring financial instruments, especially during periods of rapid price fluctuations. TradingView gathers market information from numerous financial data providers and exchanges.
The application covers a broad selection of investment categories, including:
Stocks and indices: Follow major companies and benchmarks such as NASDAQ Composite, S&P 500, Dow Jones, DAX, and FTSE 100.
Cryptocurrencies: Monitor Bitcoin, popular altcoins, and other digital assets.
Forex: Compare currency pairs and follow exchange rate movements.
Commodities: Check the prices of gold, silver, crude oil, natural gas, wheat, and other resources.
Bonds and ETFs: Explore additional financial instruments for portfolio research.
Futures and CFDs: Track price movements across supported derivative markets.
Data availability and update frequency may vary depending on the exchange, instrument, and subscription plan. Nevertheless, having multiple asset categories accessible through one application makes market monitoring considerably more convenient.
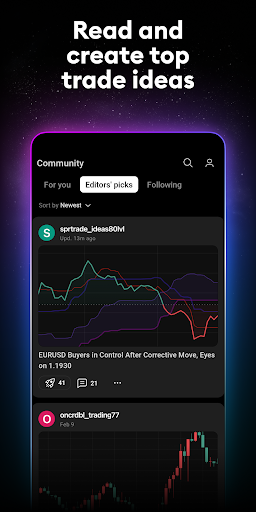
Financial research does not always have to be a solitary activity. TradingView also provides a social environment where investors and traders can exchange ideas, discuss market developments, and learn from different analytical perspectives.
Users can publish trading ideas, comment on market discussions, and follow analysts whose research interests them. This community aspect creates opportunities to discover different approaches to technical analysis and understand how other participants interpret market conditions.
Beginners can explore educational discussions, while experienced traders may use the platform to share strategies and exchange opinions. However, community posts should be treated as individual viewpoints rather than guaranteed investment recommendations.
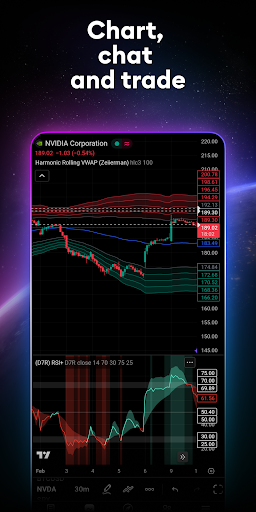
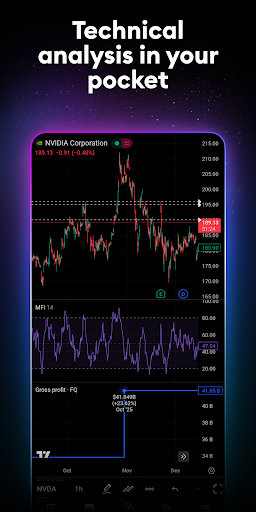
One of the platform’s strongest features is its advanced charting system. Instead of relying exclusively on basic price information, users can examine historical movements and apply different analytical techniques.
TradingView offers numerous chart formats, including traditional line and candlestick charts, alongside specialized options such as Renko and Kagi. Each format presents market information differently, helping users examine price behavior from various perspectives. The charting toolkit also includes:
Technical indicators: Apply moving averages, momentum indicators, and other analytical tools.
Drawing instruments: Mark support and resistance levels, trendlines, and important price zones.
Strategy analysis: Examine potential trading approaches using available charting functions.
Gann and Elliott Wave tools: Explore additional methods for studying market structure.
Custom chart settings: Adjust timeframes, visual elements, and display preferences.
These resources make it easier to identify potential trends, compare historical movements, and evaluate different market scenarios. The available tools may vary according to the account type and subscription.
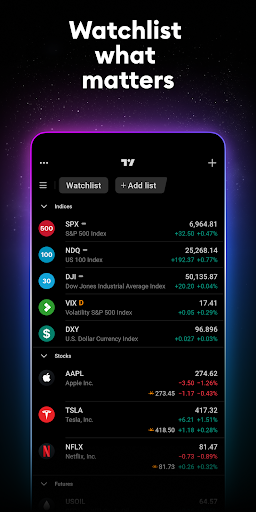
Monitoring every financial instrument manually can become exhausting, particularly when following several markets simultaneously. TradingView addresses this problem through customizable watchlists and notification settings. Users can organize stocks, currency pairs, commodities, and cryptocurrencies into separate lists according to their interests.
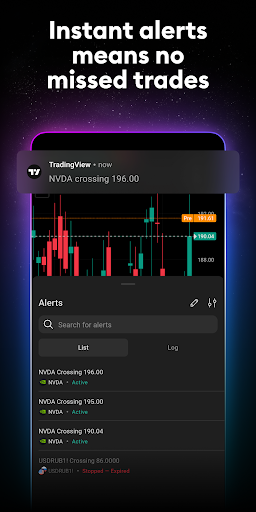
Price alerts can also be configured around selected conditions, notifying users when specific market levels or technical criteria are reached. This system helps traders stay informed about important changes without constantly checking individual charts. Alert availability and delivery options depend on the selected settings and account limitations.
Investment analysis often involves switching between smartphones, tablets, and computers. TradingView supports account synchronization, allowing users to access compatible saved information across connected devices. Watchlists, chart configurations, and other supported workspace settings can be synchronized after signing in.
This means you can begin examining a stock on your computer and continue reviewing its movements through your Android phone. Such flexibility is particularly useful for people who need to follow financial developments while away from their main workstation.
Beyond individual securities, the application provides access to important benchmarks representing different economies. These indices help users observe broader market conditions and compare regional performance. Some notable examples include:
Americas: S&P 500, Dow Jones, NASDAQ 100, Russell 2000, Bovespa, and Merval.
Europe: DAX, CAC 40, FTSE MIB, IBEX 35, and FTSE 100.
Asia-Pacific: Nikkei 225, Hang Seng, KOSPI, NIFTY 50, and S&P/ASX 200.
Africa: South Africa 40, Kenya NSE 20, and other regional benchmarks.
Middle East: EGX 30, Kuwait Main, and TA-125.
This broad coverage gives users a convenient way to compare financial markets and observe developments across different regions.
TradingView also serves people interested in raw materials and international financial markets. Users can follow commonly traded commodities such as gold, silver, oil, natural gas, cotton, sugar, corn, and wheat. The platform covers instruments from numerous exchanges, including NASDAQ, NYSE, LSE, TSE, HKEX, Euronext, ASX, and other major trading venues.
Depending on the selected instrument, users can examine current quotations, historical charts, and relevant market information. Having these resources together makes it easier to research different asset classes and understand how global financial developments may influence individual markets.
Accessing market information becomes much easier when your favorite analytical tools are available directly on your phone. To install TradingView through APKMODY, follow this simple process:
| Stage | Installation instructions |
|---|---|
| 1. Find the app | Visit APKMODY and search for TradingView. |
| 2. Select the package | Choose the Android APK version available on the download page. |
| 3. Download | Tap the download option and save the installation file. |
| 4. Install | Open the APK and grant the required installation permission if prompted. |
| 5. Get started | Launch TradingView, sign in or create an account, then customize your watchlists and charts. |
Always check the file source and requested permissions before installation. Once everything is set up, you can start following global markets, studying price movements, and organizing your financial research from your Android device.